
|
|
GreatPlacesToRetire |
| Home | Top Ranked Cities | City Guides | Videos | My City Rank |
| Williamsburg Air Quality Charles City/James City/York |
|||||
| . | Good Days | Moderate Days | Unhealthy for Sensitive Persons Days | Unhealthy Days | Very Unhealthy Days |
| 2017 | 345 | 19 | 0 | 0 | 0 |
| 2016 | 315 | 48 | 3 | 0 | 0 |
| 2015 | 333 | 25 | 1 | 0 | 0 |
| 2014 | 231 | 134 | 0 | 0 | 0 |
| 2013 | 222 | 140 | 3 | 0 | 0 |
| Williamsburg Water Quality |
|||
| . | % Good | % Threatened | % Impaired |
| 2014 | 0 | 0 | 100 |
| 2012 | 0 | 0 | 100 |
| 2010 | 0 | 0 | 100 |
| 2008 | 0 | 0 | 100 |
| 2006 | 8 | 0 | 92 |
| 2004 | na | na | na |
| 2002 | 0 | 55 | 45 |
| Williamsburg Recreation |
||
| . | # of Parks | # of Parks (99 City Avg) |
| National Parks, Historic Sites, etc. (managed by National Park Service) |
Yorktown Battlefield, Jamestown National Historic Site plus 11 more | 7 |
| National Campgrounds, Lodges, etc. (other federal agency-managed sites) |
1 | 26 |
| State Parks, Sites, etc. | 3 | 11 |
| Williamsburg Climate 1971-2000 | ||
| . | . | 99 City Avg | January - Avg Low Temp | 28 F | 27 F |
| January - Avg Daily Temp | 39 F | 37 F |
| July - Avg Daily Temp | 78 F | 74 F |
| July - Avg High Temp | 89 F | 86 F |
| Avg Annual Precipitation | 49 in | 35 in |
| Williamsburg Elevation | |
| 70 feet | GPTR 99 City Average 1,652 feet |
| Williamsburg Natural Hazards |
||
| . | Risk Level | 99 City Average |
| Total Hazard Risk | Lower | Moderate |
| Earthquake | .1% | 10.9% |
| Tsunami | No Risk | No Risk |
| Hurricane | 20-40 | 10 |
| Flood | High | Very High |
| Tornado | Low | Low |
| Volcano | No Risk | No Risk |
| Wildfire | Low | Low |
| Williamsburg Man-Made Hazards (Nuclear) |
||
| Nuclear Power Stations (# Reactors) |
Distance from City | GPTR 99 City Average |
| Surry (2) | 10 miles | 50% of cities are within 100 miles of at least one nuclear station |
| North Anna (2) | 90 miles | |
| Calvert Cliffs (2) | 95 miles | |
| Williamsburg Heating and Cooling Degree Days (avg annual) |
||
| . | . | 99 City Avg |
| Total Degree Days | 4,993 | 5,915 |
| HDD | 3,629 | 4,662 |
| CDD | 1,364 | 1,253 |
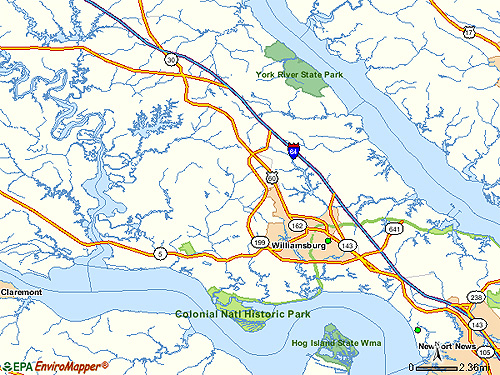
Legend: Small green circles (older style maps) or multi-colored circles (newer style maps: click here for legend) indicate 1)Superfund Sites 2)Federal Facilities 3)RCRA Corrective Action Sites and 4)Brownfields Properties)
| < Prev | 1 | 2 | 3 |
| Home | Top Ranked Cities | City Guides | Videos | My City Rank |
| Terms & Privacy | About Us | Sources Revised: 12/13/2018 Copyright © 2019 Great Places To Retire |