| Home |
| Top Ranked |
| Places Map |
| Real Estate |
| Compare Places |
| My Great Place |
| Places Data |
| State Data |
 |

|
GreatPlacesToRetire |
|
| Stamford Air Quality Fairfield County |
|||||
| . | Good Days | Moderate Days | Unhealthy for Sensitive Persons Days | Unhealthy Days | Very Unhealthy Days |
| 2017 | 267 | 82 | 12 | 4 | 0 |
| 2016 | 223 | 120 | 16 | 7 | 0 |
| 2015 | 214 | 121 | 24 | 6 | 0 |
| 2014 | 227 | 129 | 9 | 0 | 0 |
| 2013 | 200 | 146 | 18 | 1 | 0 |
| Stamford Water Quality Saugatuck & Long Island Sound Watersheds |
|||
| . | % Good | % Threatened | % Impaired |
| 2014 | na | na | na |
| 2012 | 65 | 0 | 35 |
| 2010 | 48 | 0 | 52 |
| 2008 | 47 | 0 | 53 |
| 2006 | 35 | 0 | 65 |
| 2004 | 11 | 25 | 64 |
| 2002 | 21 | 10 | 69 |
| Stamford Recreation |
||
| . | # of Parks | # of Parks (99 City Avg) |
| National Parks, Historic Sites, etc. (managed by National Park Service) |
Weir Farm National Historic Site, Castle Clinton National Monument plus 26 more | 7 |
| National Campgrounds, Lodges, etc. (other federal agency-managed sites) |
8 | 26 |
| State Parks, Sites, etc. | 58 | 11 |
| Stamford Climate (1971-2000) |
||
| . | . | 99 City Avg | January - Avg Low Temp | 19 F | 27 F |
| January - Avg Daily Temp | 29 F | 37 F |
| July - Avg Daily Temp | 74 F | 74 F |
| July - Avg High Temp | 85 F | 86 F |
| Avg Annual Precipitation | 53 in | 35 in |
| Stamford Elevation | |
| 190 feet | GPTR 99 City Average 1,652 feet |
| Stamford Natural Hazards |
||
| . | Risk Level | 99 City Average |
| Total Hazard Risk | Moderate | Moderate |
| Earthquake | .6% | 10.9% |
| Tsunami | No Risk | No Risk |
| Hurricane | 20-40 | 10 |
| Flood | Very High | Very High |
| Tornado | Low | Low |
| Volcano | No Risk | No Risk |
| Wildfire | Low | Low |
| Stamford Man-Made Hazards (Nuclear) |
||
| Nuclear Power Stations (# Reactors) |
Distance from City | GPTR 99 City Average |
| Indian Point (2) | 25 miles | 50% of cities are within 100 miles of at least one nuclear station |
| Millstone (2) | 80 miles | |
| Stamford Heating and Cooling Degree Days (avg annual) |
||
| . | . | 99 City Avg |
| Total Degree Days | 6,274 | 5,915 |
| HDD | 5,582 | 4,662 |
| CDD | 692 | 1,253 |
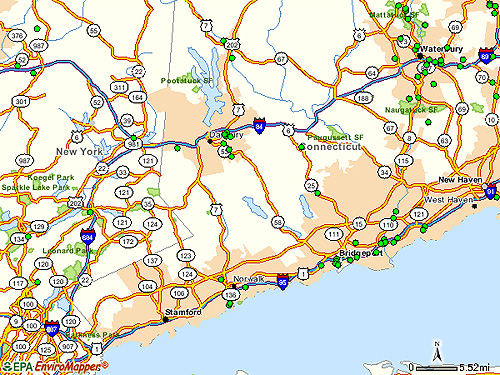
Legend: Small green circles (older style maps) or multi-colored circles (newer style maps: click here for legend) indicate 1)Superfund Sites 2)Federal Facilities 3)RCRA Corrective Action Sites and 4)Brownfields Properties (EPA hazardous material cleanup sites defined at Environment link)
| < Prev | 1 | 2 | 3 |
| You also might like: | |||
 |  |  |  |
| Annapolis has Similar Geography & Climate | Check the Stamford Profile Page | Compare Other East Coast Retirement Cities | Video Tours for Connecticut Retirement Cities |
 | Terms & Privacy | Site Map | About Us | Sources | Links | Advertise | Revised: 12/13/2018 Copyright © 2019 Great Places To Retire |