| Home |
| Top Ranked |
| Places Map |
| Real Estate |
| Compare Places |
| My Great Place |
| Places Data |
| State Data |
 |

|
GreatPlacesToRetire |
|
| Missoula Air Quality Missoula County |
|||||
| . | Good Days | Moderate Days | Unhealthy for Sensitive Persons Days | Unhealthy Days | Very Unhealthy Days |
| 2017 | 111 | 181 | 24 | 14 | 35 |
| 2016 | 166 | 175 | 25 | 0 | 0 |
| 2015 | 184 | 157 | 14 | 10 | 0 |
| 2014 | 222 | 125 | 16 | 2 | 0 |
| 2013 | 160 | 181 | 18 | 6 | 0 |
| Missoula Water Quality Upper Clark Fork, Middle Clark Fork & Bitterroot Watersheds |
|||
| . | % Good | % Threatened | % Impaired |
| 2014 | 25 | 0 | 75 |
| 2012 | 25 | 0 | 75 |
| 2010 | 9 | 0 | 91 |
| 2008 | 25 | 0 | 75 |
| 2006 | 9 | 0 | 91 |
| 2004 | 32 | 0 | 68 |
| 2002 | 32 | 0 | 68 |
| Missoula Recreation |
||
| . | # of Parks | # of Parks (99 City Avg) |
| National Parks, Historic Sites, etc. (managed by National Park Service) |
Big Hole National Battlefield, Nez Perce National Historical Park plus 1 more | 7 |
| National Campgrounds, Lodges, etc. (other federal agency-managed sites) |
36 | 26 |
| State Parks, Sites, etc. | 7 | 11 |
| Missoula Climate (1971-2000) |
||
| . | . | 99 City Avg | January - Avg Low Temp | 17 F | 27 F |
| January - Avg Daily Temp | 25 F | 37 F |
| July - Avg Daily Temp | 66 F | 74 F |
| July - Avg High Temp | 82 F | 86 F |
| Avg Annual Precipitation | 17 in | 35 in |
| Missoula Elevation | |
| 3,420 feet | GPTR 99 City Average 1,652 feet |
| Missoula Natural Hazards |
||
| . | Risk Level | 99 City Average |
| Total Hazard Risk | Moderate | Moderate |
| Earthquake | 15% | 10.9% |
| Tsunami | No Risk | No Risk |
| Hurricane | 0 | 10 |
| Flood | Very High | Very High |
| Tornado | Very Low | Low |
| Volcano | No Risk | No Risk |
| Wildfire | High | Low |
| Missoula Man-Made Hazards (Nuclear) |
||
| Nuclear Power Stations (# Reactors) |
Distance from City | GPTR 99 City Average |
| Columbia (1) | 230 miles | 50% of cities are within 100 miles of at least one nuclear station |
| Missoula Heating and Cooling Degree Days (avg annual) |
||
| . | . | 99 City Avg |
| Total Degree Days | 7,860 | 5,915 |
| HDD | 7,562 | 4,662 |
| CDD | 298 | 1,253 |
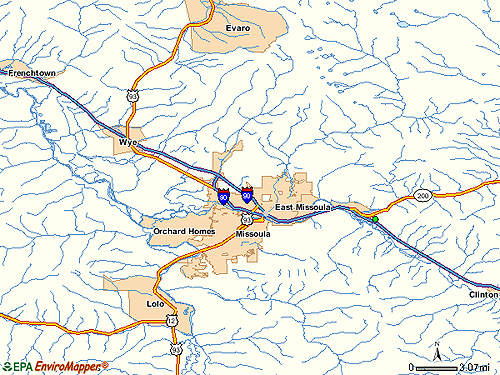
Legend: Small green circles (older style maps) or multi-colored circles (newer style maps: click here for legend) indicate 1)Superfund Sites 2)Federal Facilities 3)RCRA Corrective Action Sites and 4)Brownfields Properties (EPA hazardous material cleanup sites defined at Environment link)
| < Prev | 1 | 2 | 3 |
| You also might like: | |||
 |  |  |  |
| Boise has Similar Geography & Climate | Colorado Springs has Similar Geography & Climate | Santa Fe has Similar Geography & Climate | Compare Other Cool & Dry Retirement Cities |
 | Terms & Privacy | Site Map | About Us | Sources | Links | Advertise | Revised: 12/13/2018 Copyright © 2019 Great Places To Retire |