| Home |
| Top Ranked |
| Places Map |
| Real Estate |
| Compare Places |
| My Great Place |
| Places Data |
| State Data |
 |

|
GreatPlacesToRetire |
|

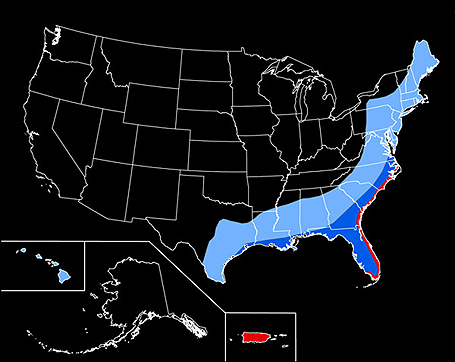
This map shows the number of hurricanes predicted to occur in the next 100 years - 0 (black), 20-40 (light blue), 40-60 (dark blue) and greater than 60 (red). Source: USGS.
| Terms & Privacy | Site Map | About Us | Sources | Links | Advertise | Revised: 12/13/2018 Copyright © 2019 Great Places To Retire |