| Home |
| Top Ranked |
| Places Map |
| Real Estate |
| Compare Places |
| My Great Place |
| Places Data |
| State Data |
 |

|
GreatPlacesToRetire |
|

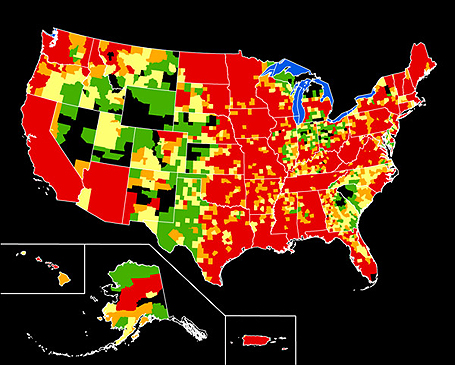
This map shows flood-related disaster declarations in the U.S. between 1965 and 2003. Zero declarations are represented in black, 1 declaration in green, 2 declarations in yellow, 3 declarations in orange and 4 or more declarations in red. Sources: USGS, FEMA.
| Terms & Privacy | Site Map | About Us | Sources | Links | Advertise | Revised: 12/13/2018 Copyright © 2019 Great Places To Retire |